Unlocking Insights: A Practical Guide to Qualitative Data Analysis Methods
Qualitative data analysis methods are how we make sense of non-numerical information, like what people say in interviews, write in open-ended surveys, or share in focus groups. It’s all about digging past the surface of raw text to find the hidden themes, patterns, and insights that explain why people think and act the way they do.
What Is Qualitative Data Analysis?
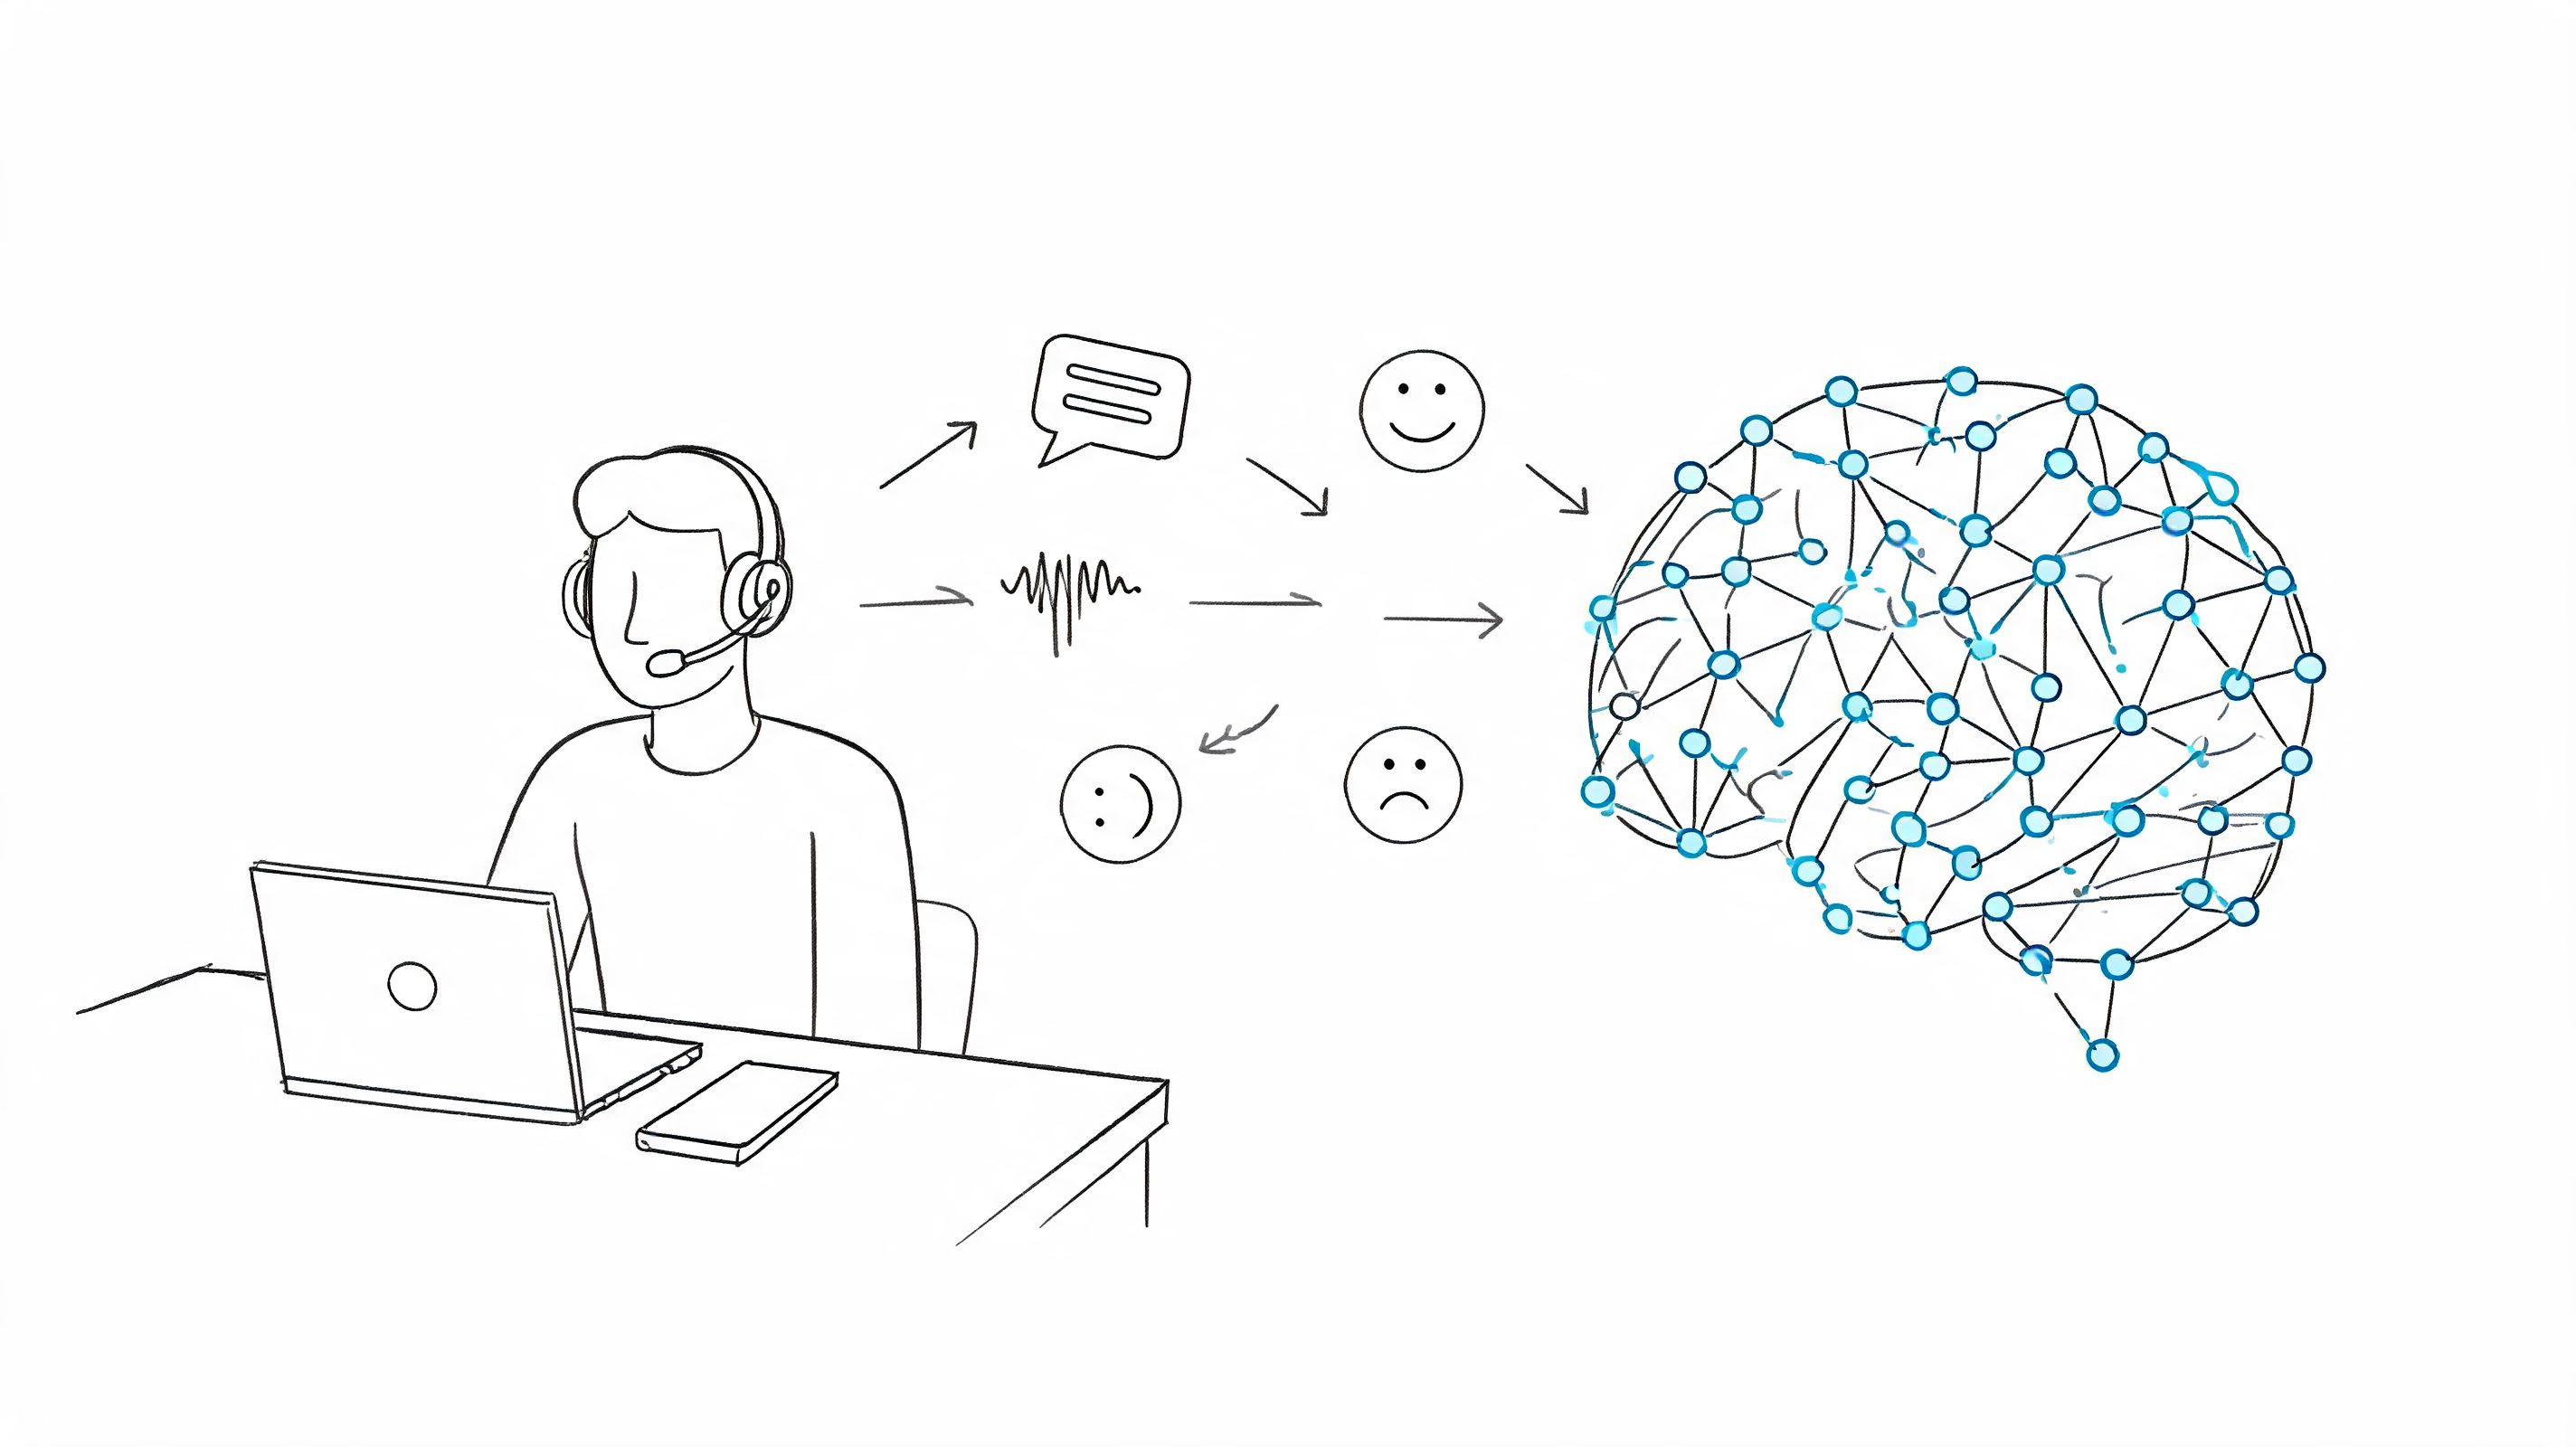
Imagine you're a detective with a desk full of witness statements, scribbled notes, and crime scene observations. Your job is to piece it all together to tell the complete story. That’s what qualitative data analysis feels like in practice. You’re not just crunching numbers; you're systematically sifting through words, context, and emotion to uncover the narratives buried within. The main goal is to bring order, meaning, and interpretation to what often starts as a messy pile of unstructured data.

This process is what turns a mountain of raw text—from interview transcripts and focus group discussions to customer support tickets—into genuine understanding. Instead of just counting how many people clicked a button, qualitative analysis helps you understand the why behind their actions. Why did they hesitate before clicking? What were they thinking at that moment? How did that particular step make them feel?
What is the goal of analyzing qualitative data?
At its heart, this kind of analysis is a search for meaning. It’s the key to understanding complex human experiences that you just can't boil down to a simple number. While quantitative data tells you what happened, qualitative data reveals the story behind it.
Let me give you a concrete example from my own experience. A company I worked with saw a 30% drop-off rate on their checkout page. That's a "what."
By conducting a handful of user interviews, we uncovered the "why":
- Users described the shipping costs as "shockingly high."
- The checkout form was repeatedly called "confusing and way too long."
- Several participants admitted they "didn't trust the site with their credit card information."
That’s the kind of actionable context that helps you fix the right problem. To get a better handle on the different ways to approach this, it’s worth exploring various qualitative data analysis techniques. Knowing these methods is the first step toward turning raw feedback into smart business decisions or solid research findings.
From my experience, the real power of qualitative analysis is its ability to give a voice to your data. It turns individual comments into representative themes, providing a rich, contextual understanding that numbers alone can never offer.
This foundation is crucial because it shapes everything from product roadmaps to marketing campaigns. Whether you're trying to build a better product, write a more compelling message, or improve team morale, getting inside the heads of your audience is non-negotiable. By analyzing qualitative data, you're not just collecting comments; you're building empathy and getting a clear roadmap for solving real human problems.
Choosing Your Qualitative Analysis Framework
Stepping into the world of qualitative data analysis can feel a bit like walking into a specialized workshop. You're surrounded by all sorts of tools, each one designed for a very specific job. Picking the right one is the first, and most important, step toward getting a meaningful result. This isn't just an academic box-ticking exercise; it's a strategic decision that fundamentally shapes what you can learn from your data.
Your choice of framework determines how you'll approach your transcripts, notes, and observations. Are you looking for broad, repeating patterns across dozens of interviews? Or are you trying to build a new theory from the ground up, based on the unique experiences of just a few people? Each goal demands a different analytical lens.
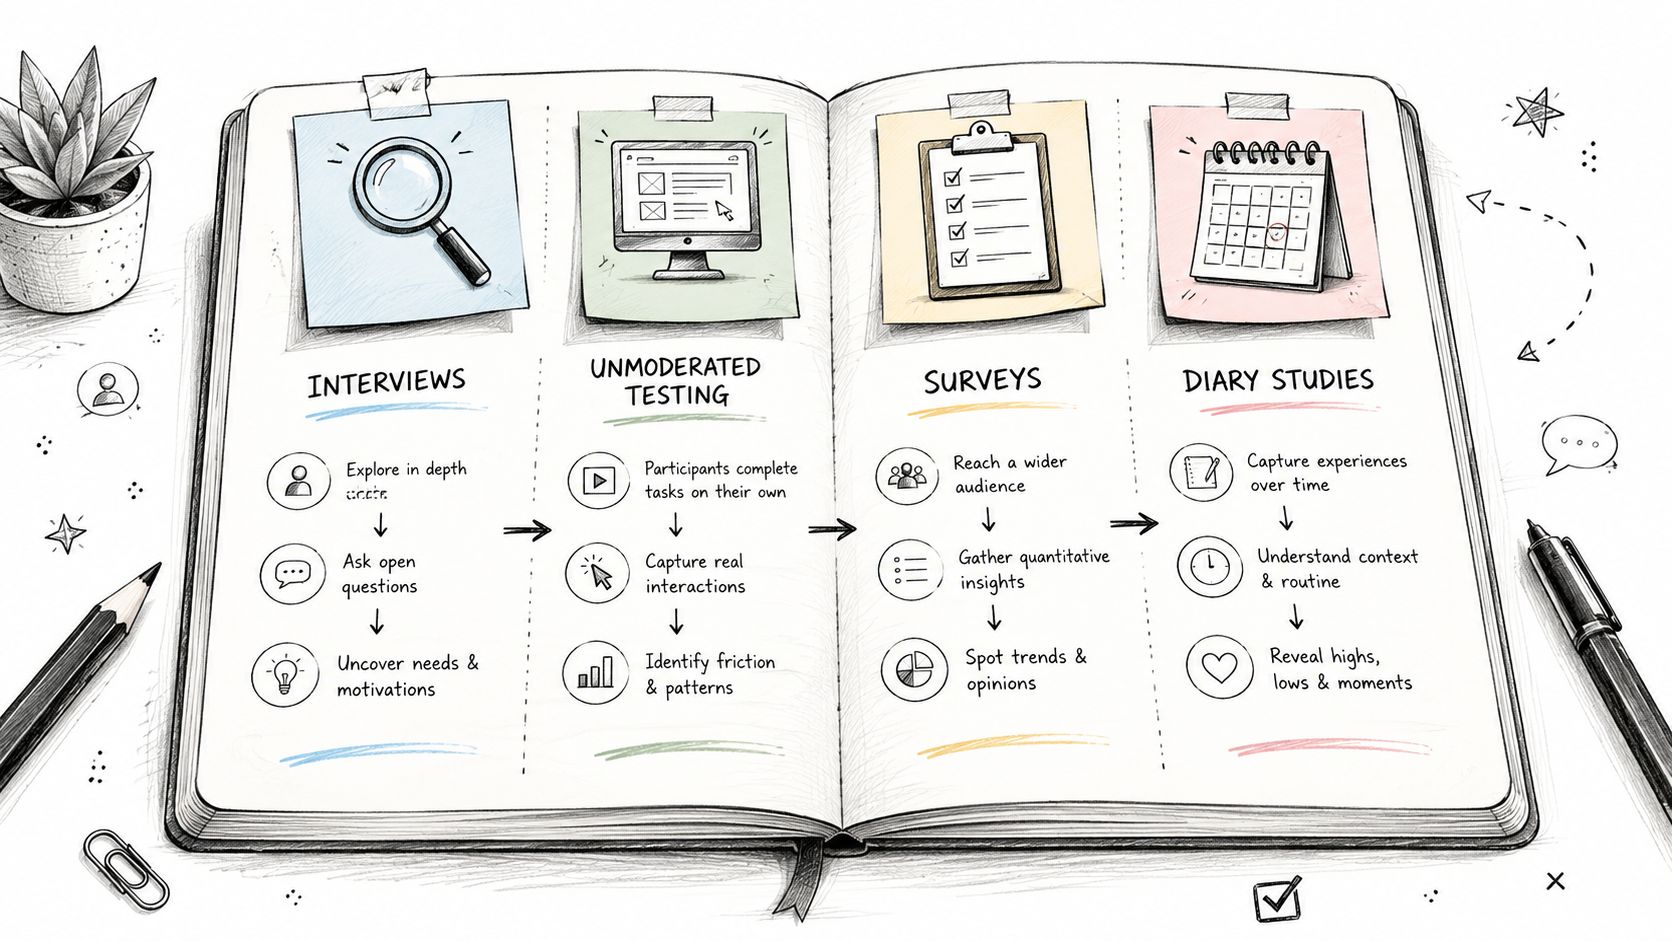
Understanding The Five Core Methods
While the field is vast, five core methods have become the go-to choices in both academic research and business. Each one offers a unique way to turn a mountain of raw text into clear, actionable insights. Getting a handle on their purpose is the key to picking the right one for your project.
The modern versions of these methods really took shape in the 20th century. Thematic Analysis, Content Analysis, and Grounded Theory became dominant approaches between the 1960s and 1990s. Of course, the roots of qualitative inquiry go back much further, but this period gave us the solid frameworks we rely on today. For a deeper dive, you can explore the rich history of qualitative research to see how these ideas evolved.
Thematic Analysis: Finding Patterns
Thematic Analysis is often the first method people learn, and for good reason—it’s flexible, intuitive, and incredibly powerful. Think of it like sorting a giant bin of LEGOs by color. Your goal is simple: identify, analyze, and report the patterns (or themes) that keep showing up in your data.
This is the perfect choice when you need to understand the common threads running through a set of interviews or survey responses. What topics come up again and again? What are the shared frustrations your customers are talking about? Thematic analysis helps you answer these questions by systematically coding your data and then grouping those codes into bigger, more meaningful themes.
Content Analysis: Counting And Categorizing
Content Analysis is a more systematic cousin of thematic analysis, and it often leans toward the quantitative. While thematic analysis is all about the underlying meaning, content analysis can be used to count the frequency of specific words, phrases, or concepts. It’s like being a librarian who not only organizes books by genre but also keeps a running tally of how many books are in each section.
This method shines when you have large volumes of text and want to know how prevalent certain topics are. For example, a marketing team could use it to track how often competitors are mentioned in customer reviews or to measure shifts in brand sentiment over time.
Pro Tip: Thematic and Content Analysis aren't mutually exclusive—they can be powerful when used together. You might start with content analysis to see which keywords appear most often, then switch to thematic analysis to dig into why those words are so common.
Grounded Theory: Building From Scratch
Grounded Theory is for the explorers and the builders. Unlike other methods where you might start with a theory you want to test, here you go in with a completely open mind. The whole point is to develop a new theory that is "grounded" in the data you collect. You're like a detective arriving at a crime scene with no suspects, building a case purely from the evidence you find.
This approach is ideal when you're researching something new or poorly understood. A team developing an innovative software product could use grounded theory to understand the emerging work habits of their ideal users, building a theory about their needs that directly informs what gets built.
Narrative Analysis: Focusing On Stories
Humans are hardwired for storytelling, and Narrative Analysis is the method that honors this. It focuses on the stories people tell and, just as importantly, how they tell them. You look at the structure of the story, the language used, and the context around it to understand how individuals make sense of their own lives and experiences.
Imagine you're analyzing interviews with people who made a major career change. Narrative analysis wouldn't just pull out themes like "burnout" or "seeking purpose." It would examine each person's entire journey—the beginning, the turning point, the resolution—to uncover deeper truths about their identity and motivation.
Discourse Analysis: Examining Language And Power
Discourse Analysis takes a step back to look at the bigger picture. It goes beyond what is said to examine how it's said and the social context that gives the language its meaning. This method explores how language is used to build versions of reality, maintain social structures, and exert power. It’s the most "macro" of the methods, looking at broad societal patterns reflected in how we communicate.
A researcher might use discourse analysis to study company mission statements, for instance. They wouldn't just take the words at face value. Instead, they'd analyze how the language reflects the company's culture, positions it against competitors, and communicates power dynamics to both employees and customers. It’s less about one person's story and more about the social forces shaping our world.
To help you decide which approach is right for you, here’s a quick-reference table that breaks down the primary goal and outcome for each method.
Choosing The Right Qualitative Analysis Method
Choosing a method isn't about finding the "best" one overall, but the best one for the questions you're trying to answer. Use this table as a starting point to align your research goals with the right analytical tool for the job.
A Practical Walkthrough of Thematic Analysis
When you're new to qualitative analysis, Thematic Analysis is often the best place to start. It’s one of the most flexible and straightforward methods out there.
Think of it like organizing a messy garage. You start with a jumble of stuff (your data), sort it into piles like "gardening tools" or "sports equipment" (these are your codes), and then label bigger sections of the garage "Lawn Care" or "Camping Gear" (these are your themes). It's a structured way to find meaningful patterns in what can feel like a chaotic amount of information.
Let's ground this in a real-world scenario. Say you’ve just wrapped up five interviews with new customers about their experience with your mobile app's setup process. You've got pages of transcripts filled with their thoughts, frustrations, and lightbulb moments. Thematic analysis gives you a reliable, six-step process to turn all those individual comments into a handful of powerful, actionable insights.
Of course, your research goal dictates which method you should choose. This decision tree can help you see where Thematic Analysis fits in, especially when compared to a method like Grounded Theory.
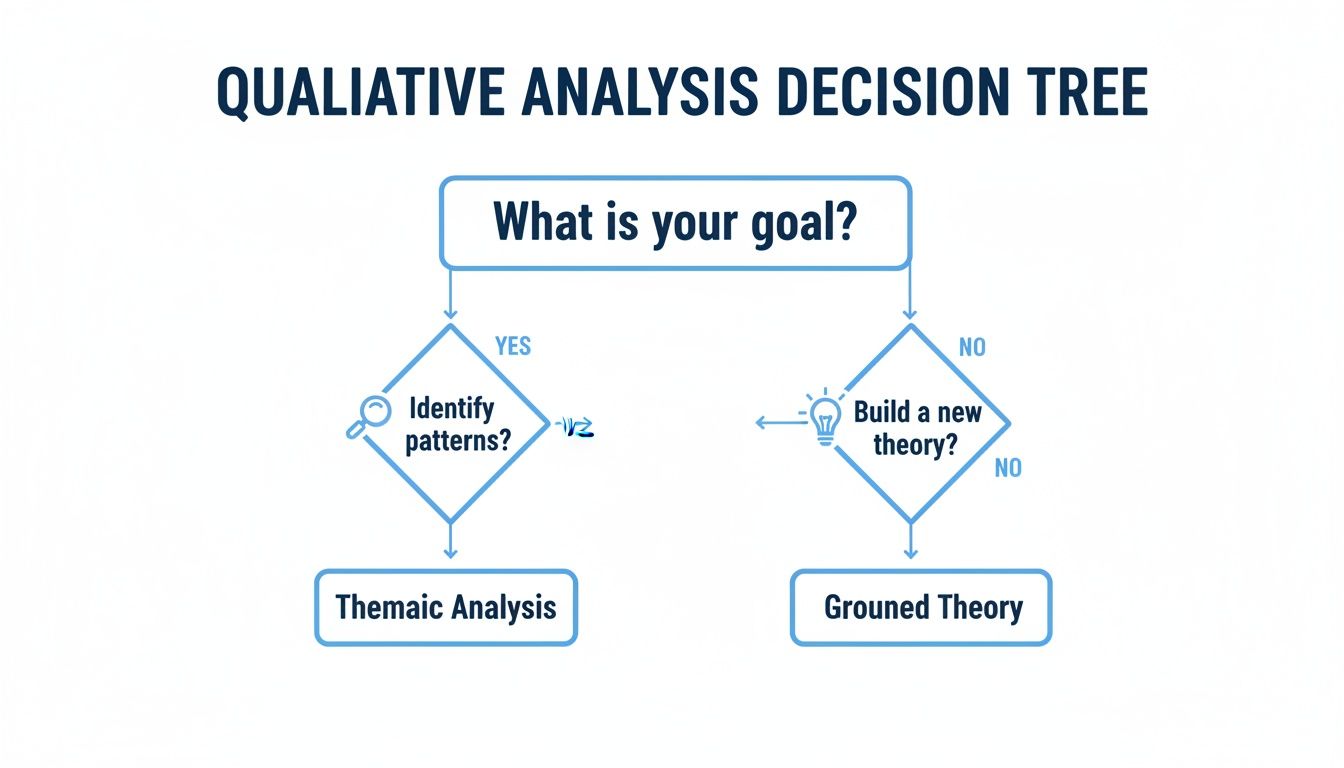
As you can see, if your main objective is to pinpoint common patterns and summarize them clearly, Thematic Analysis is almost always your best bet.
Step 1: Get to Know Your Data
First things first: you can't organize what you don't understand. This initial step is all about immersion. Don't just skim your interview transcripts—read them through a few times. Listen to the audio recordings again if you have them. Your goal here isn't to start analyzing but simply to absorb the material and jot down any initial thoughts or phrases that jump out at you.
Step 2: Generate Initial Codes
Now the real sorting starts. A code is just a short, descriptive label for a chunk of data. It’s a way of tagging an interesting idea or concept.
For example, as you read through your transcripts, you might see a user say, "I had no idea where to click first." You could highlight that and tag it with the code 'unclear first step'. Another user might mention, "The checkout process was super fast," which you could simply code as 'fast checkout'.
Think of codes as the individual LEGO bricks of your analysis. They're the small, foundational pieces you'll use later to build the larger structures—your themes. Don't overthink it at this stage; just focus on capturing every distinct idea you find.
This phase is all about breaking down dense text into bite-sized, meaningful units. For a deeper dive into this part of the process, check out our guide on how to analyze interview data.
Step 3: Start Searching for Themes
With a list of codes in hand, it's time to zoom out and look for patterns. A theme is a bigger, more significant pattern that connects several of your individual codes. It's the "so what?" behind the data.
You’ll start to see your codes naturally clustering together. For instance, you might notice that a few codes all point to a similar experience:
- Potential Theme: User Onboarding Challenges
- Supporting Codes: 'unclear first step', 'confusing navigation', 'skipped tutorial'
And another group might tell a different story:
- Potential Theme: Positive Checkout Experience
- Supporting Codes: 'fast checkout', 'easy payment', 'clear confirmation'
Think of this step as creating a mind map. You're visually grouping related codes to see what larger stories begin to emerge.
Step 4: Review and Refine Your Themes
This step is your quality check. Take a hard look at the themes you've drafted and ask yourself two simple but critical questions:
- Do all the codes I've put under this theme really belong together?
- Does the theme as a whole accurately reflect the data in those codes?
You might find that 'unclear first step' is actually such a huge problem that it deserves to be its own theme. Or maybe you'll realize that 'fast checkout' and 'easy payment' are just two sides of the same coin, and you can merge them into a more powerful theme called "Frictionless Transaction." This is where you tweak, combine, and split your themes until they feel solid and tell a logical, cohesive story.
Step 5: Define and Name Your Themes
Once you're confident in your themes, it's time to make them official. For each one, write a short paragraph that clearly defines what it means and why it's important. Then, give each theme a final, descriptive name.
For example, a generic name like "Onboarding" is okay, but "Initial Confusion During Onboarding" is so much better. It instantly tells the reader what the story is about.
Step 6: Write Up Your Report
You've done the hard work—now it's time to share your findings. Your goal is to tell the story you've uncovered in the data, using your well-defined themes as the main chapters.
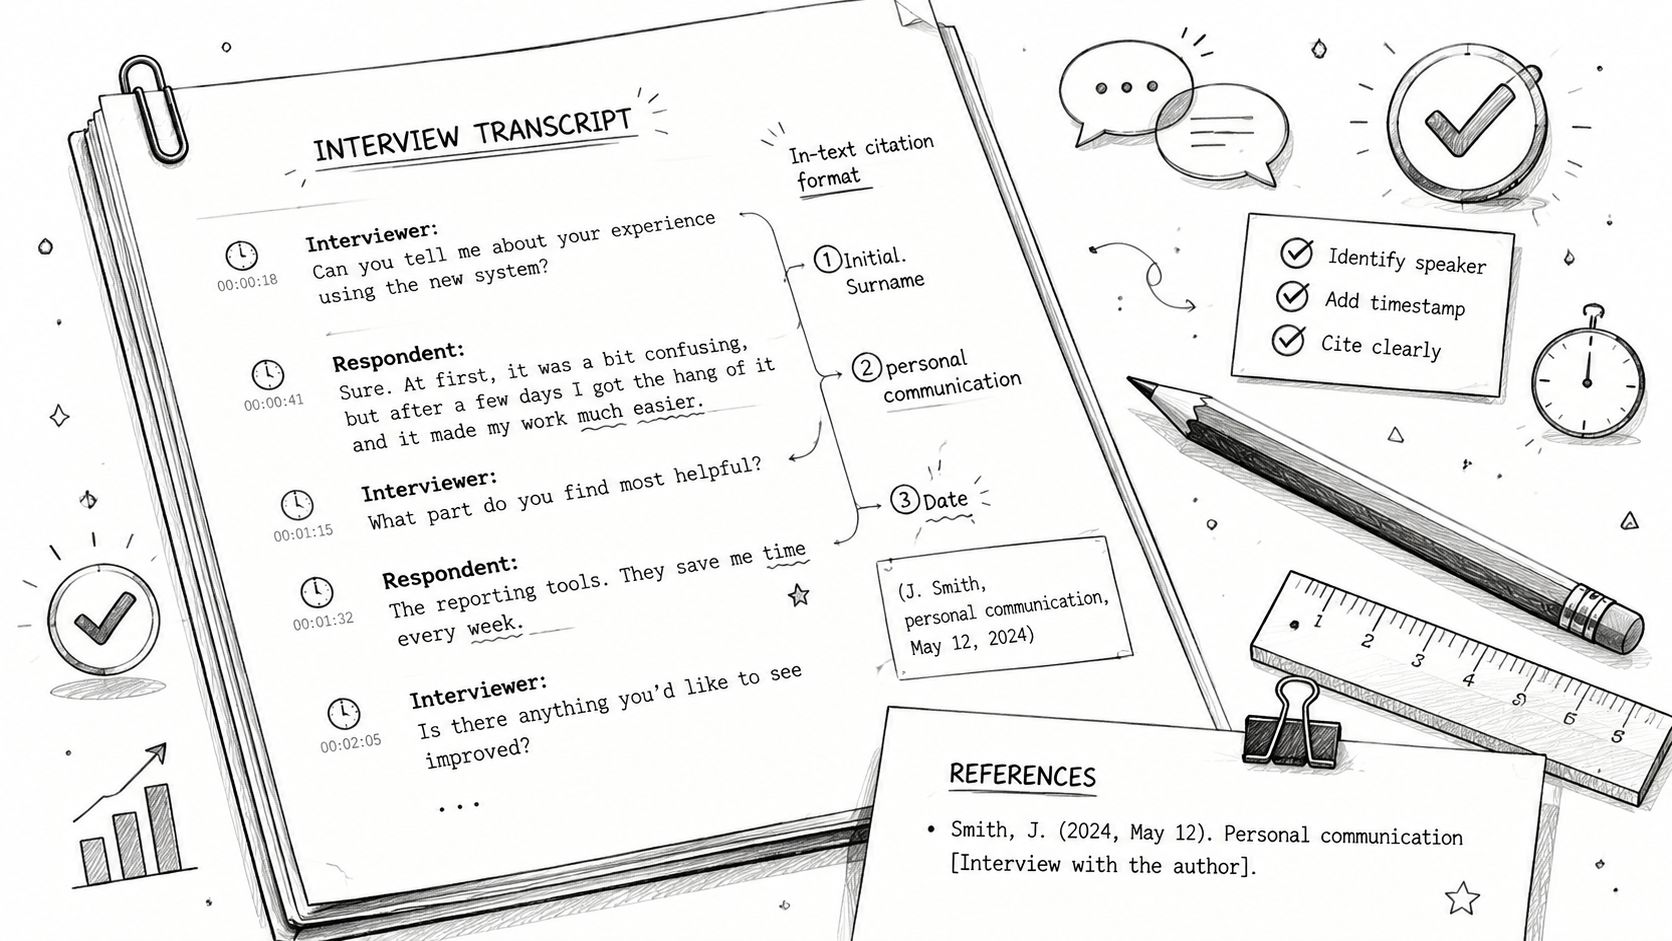
Bring your analysis to life by weaving in powerful, anonymous quotes from your participants. This is how you transform a systematic process into an engaging narrative that can actually drive meaningful decisions and spark real change.
Using Modern Tools to Streamline Your Analysis
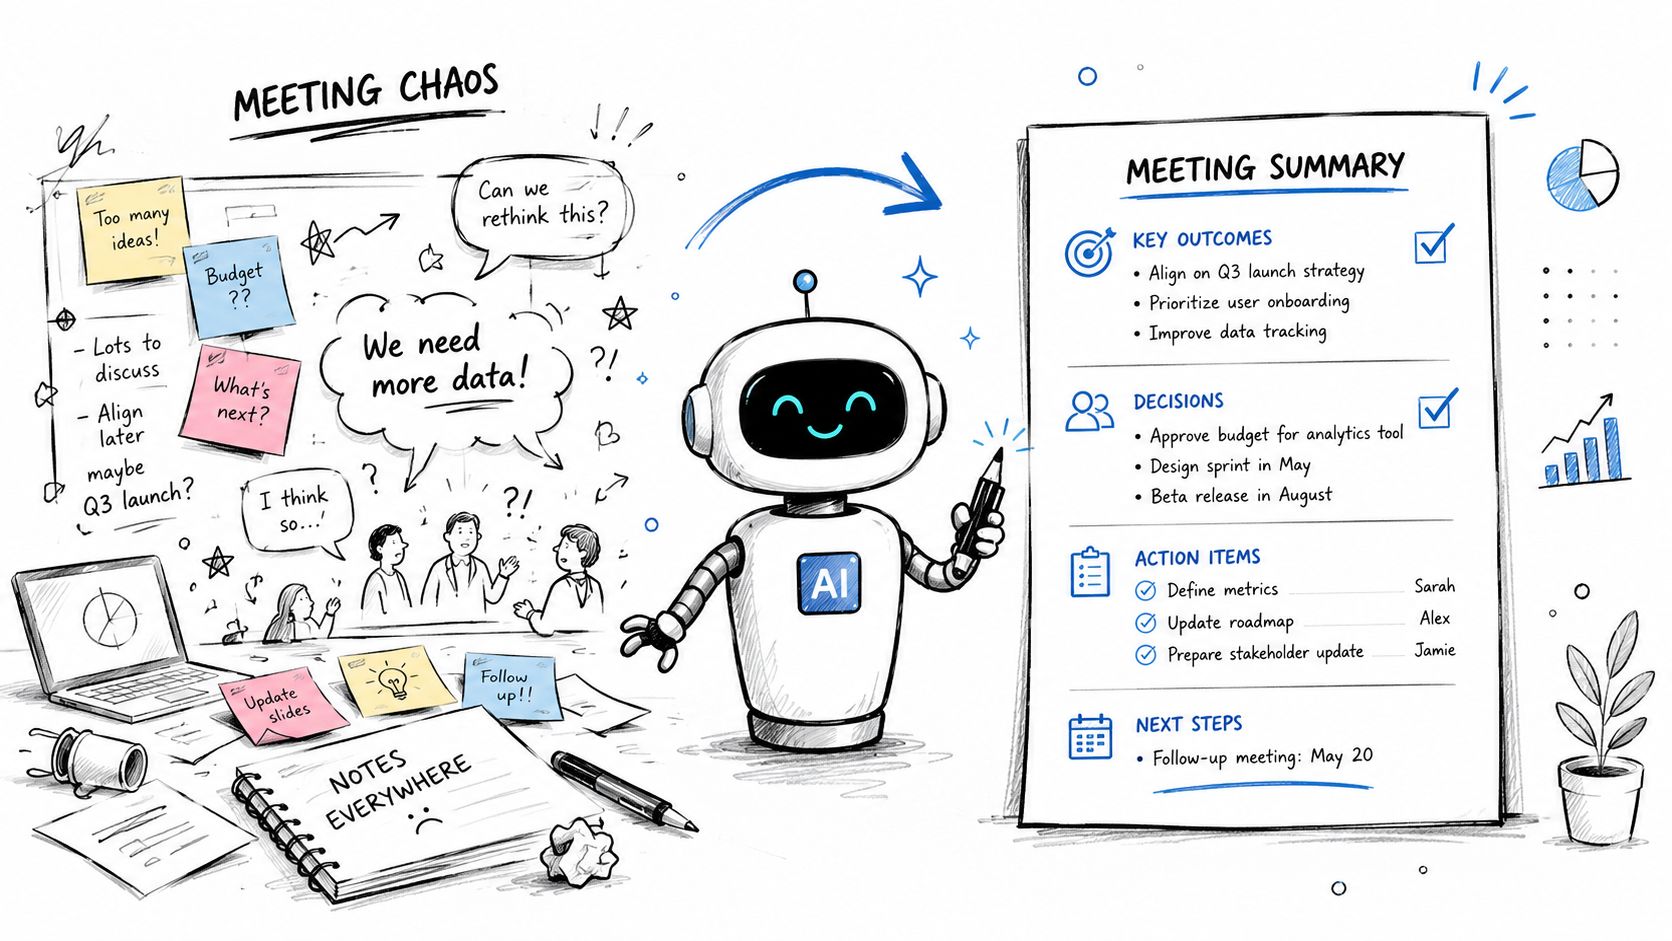
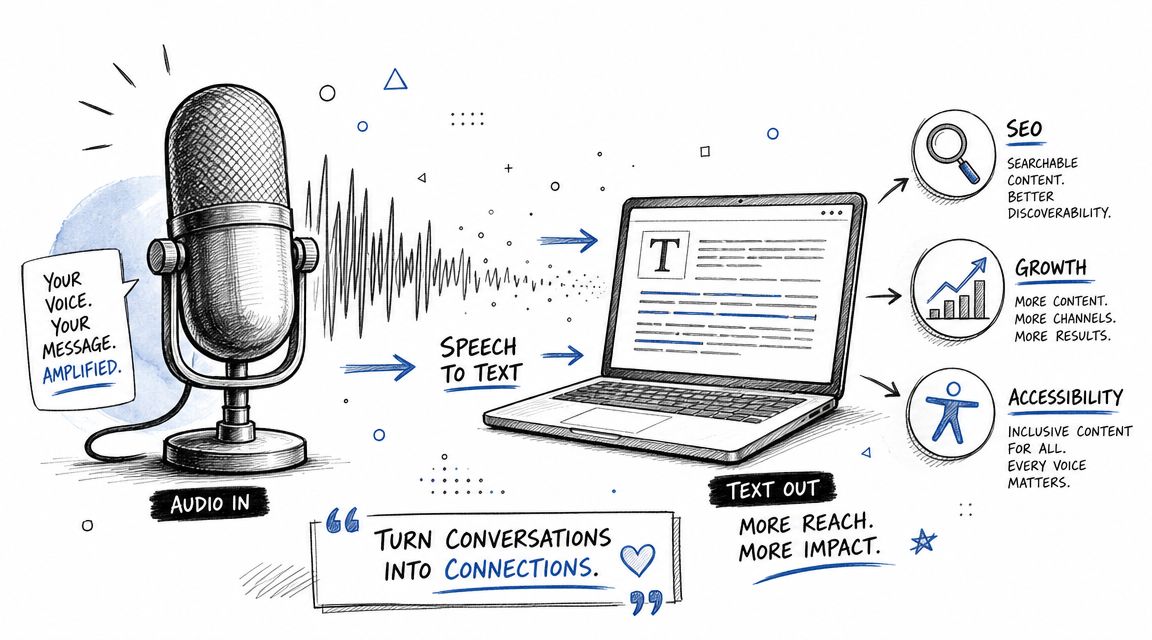
While the core principles of qualitative analysis are timeless, the tools we use to do the work have come a long way. Let's be honest: the biggest hurdle in any qualitative project has always been the sheer amount of time it takes. Just think about it. Manually transcribing hours of audio and then reading every single line to get a feel for the data can burn through weeks before the real analysis even starts.
This is where technology really changes the game. Modern tools, particularly those powered by AI, can slash the time spent on data prep. This frees you up to focus on what you do best—interpreting the data and finding those crucial insights. The goal isn't to have a robot do your thinking; it's to automate the tedious, repetitive work that gets in the way of it.
From Manual Transcription to Automated Accuracy
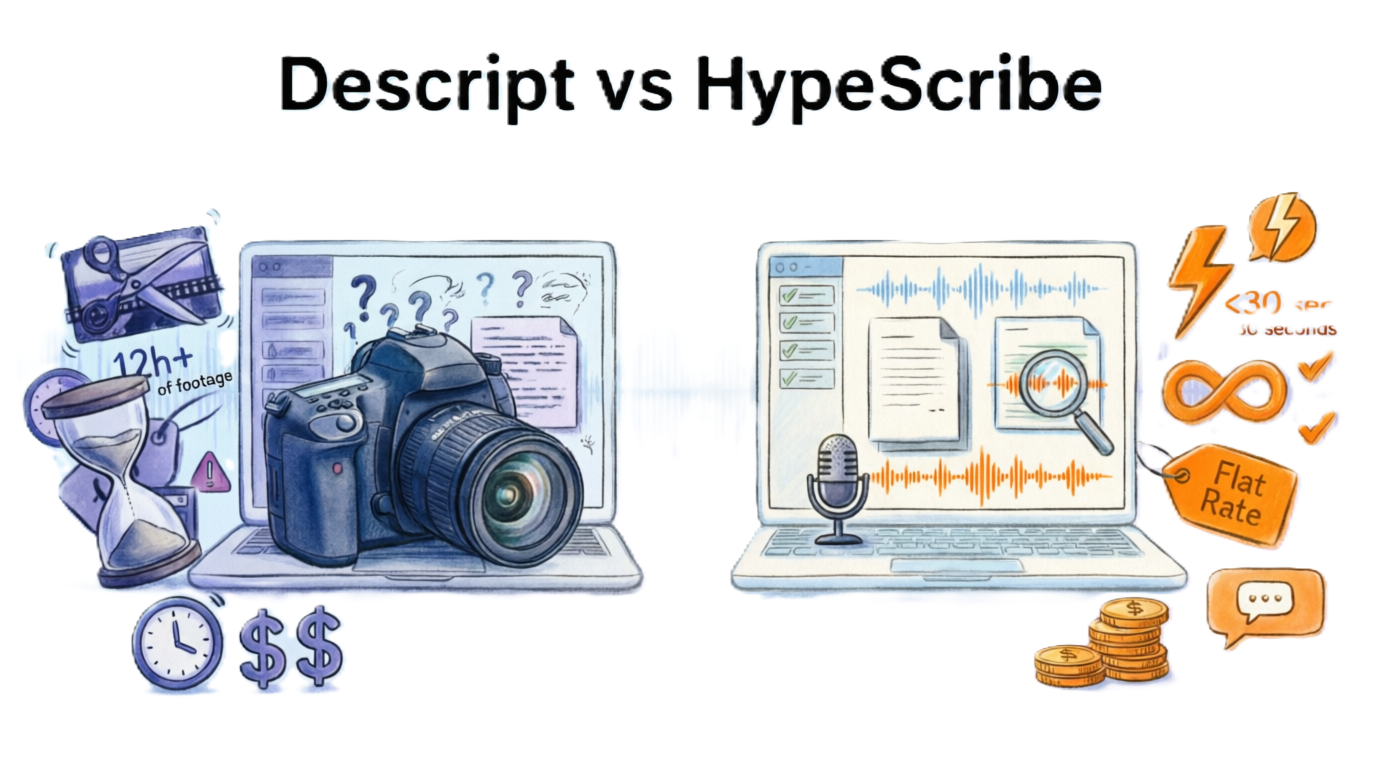
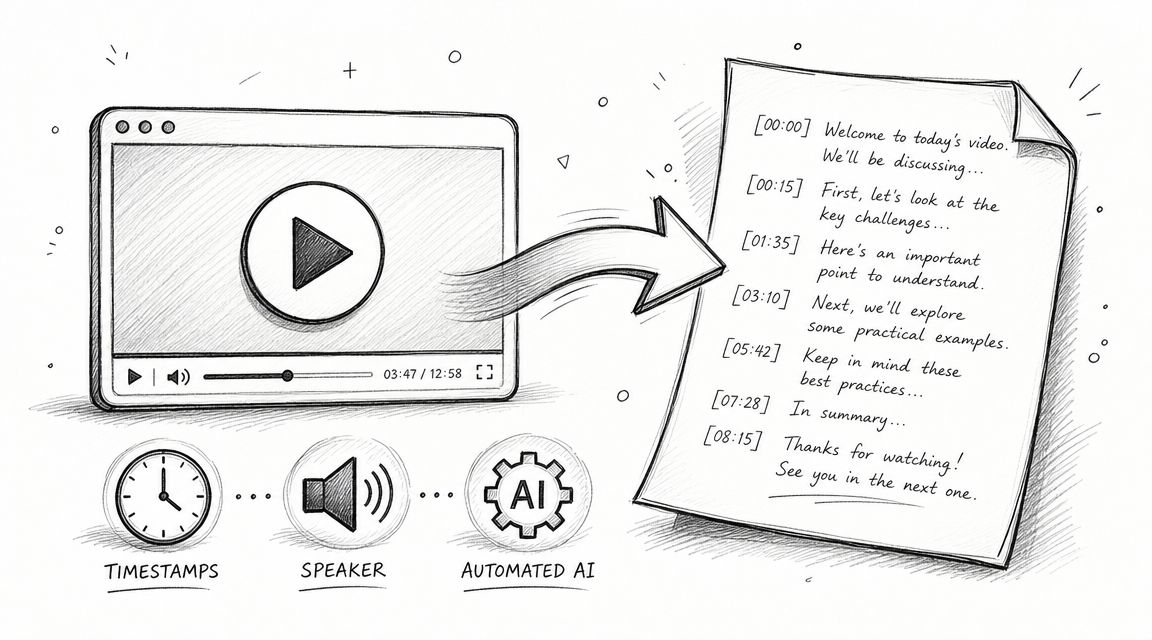
The single most draining task in analyzing interviews or meetings? Transcription. For every one hour of audio, you could easily spend four to six hours typing it out by hand. That’s a massive time sink.
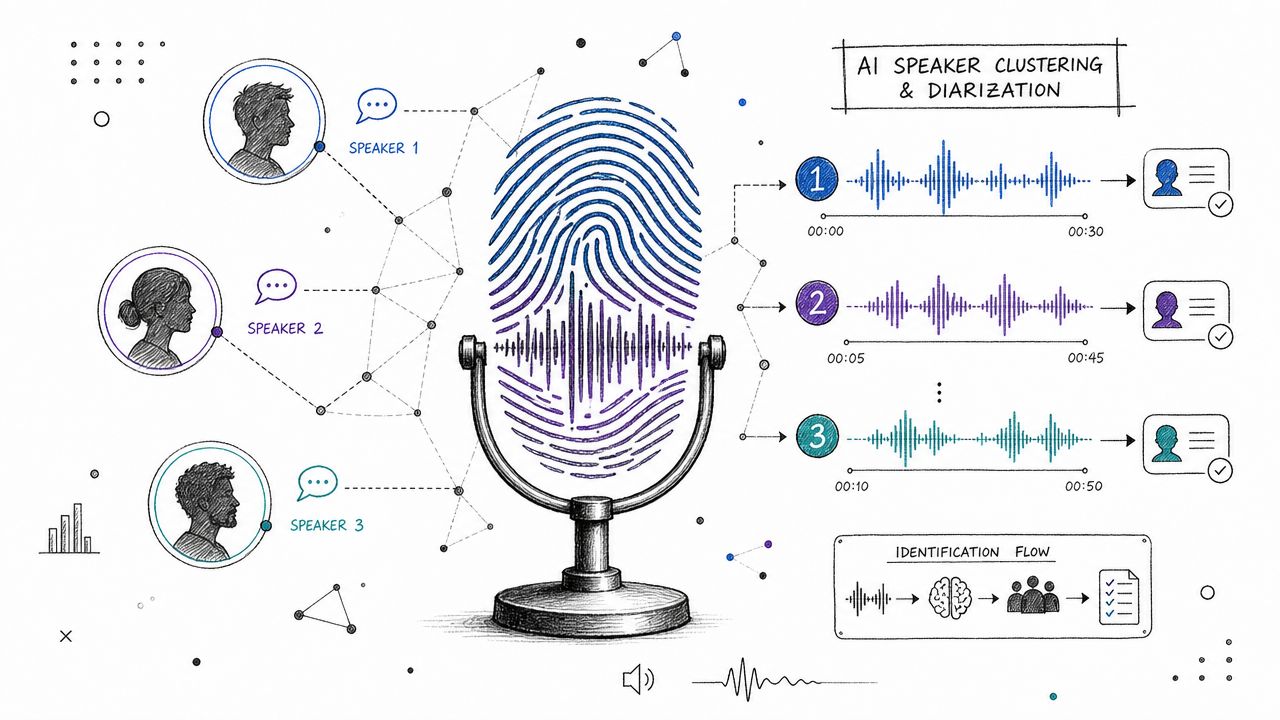
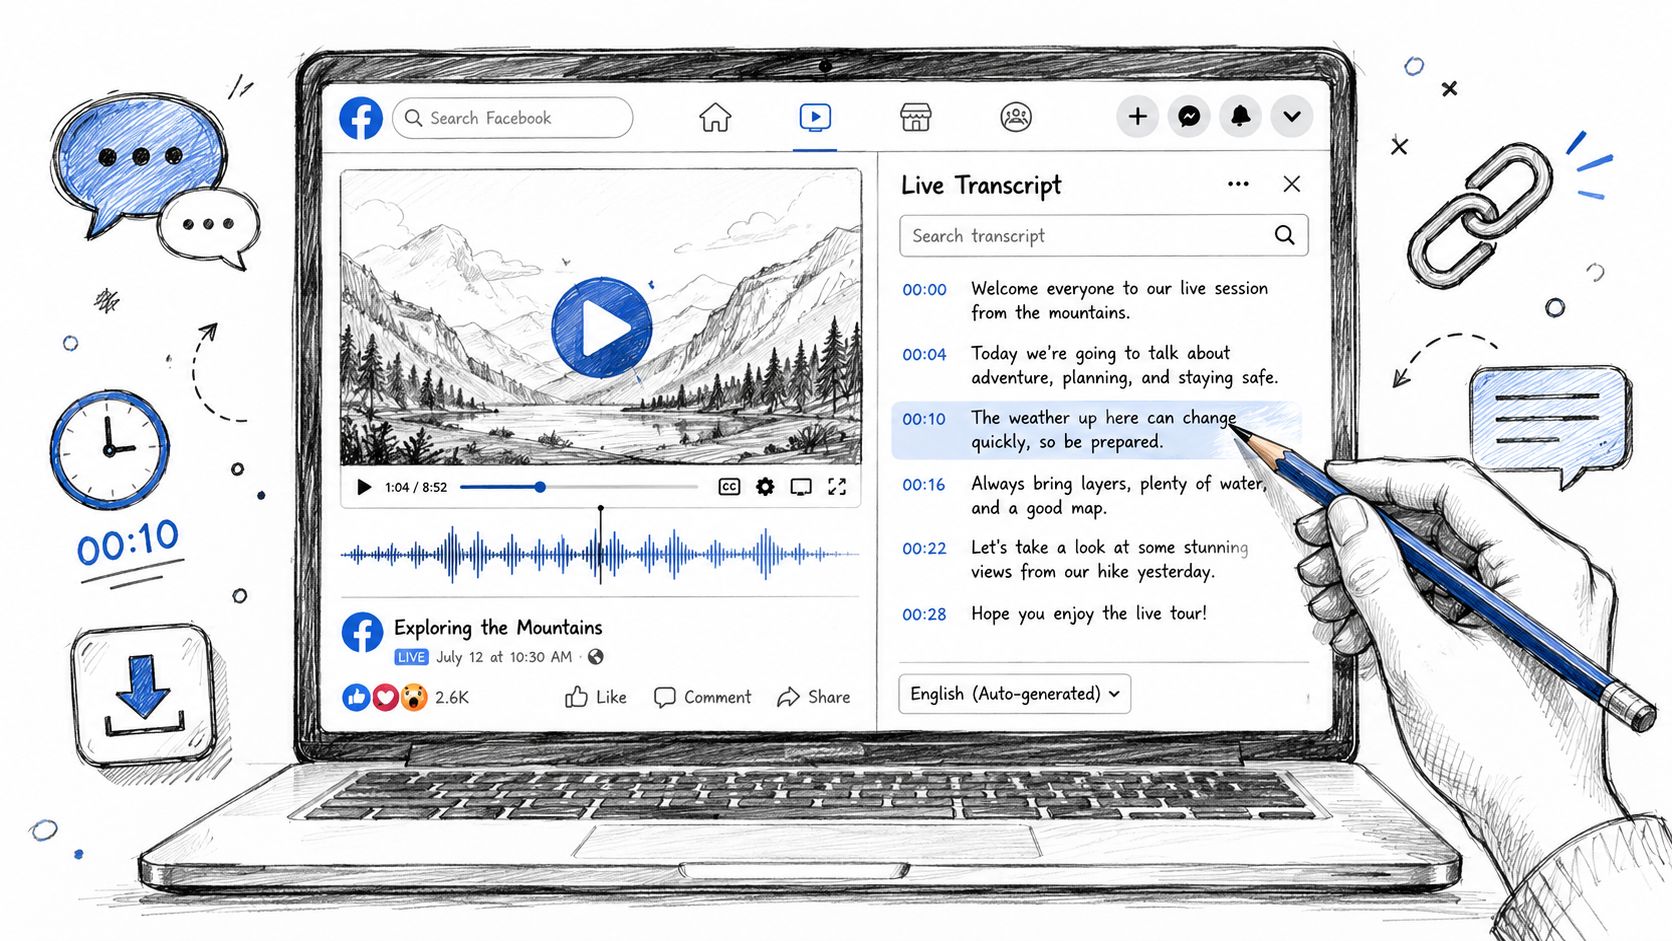
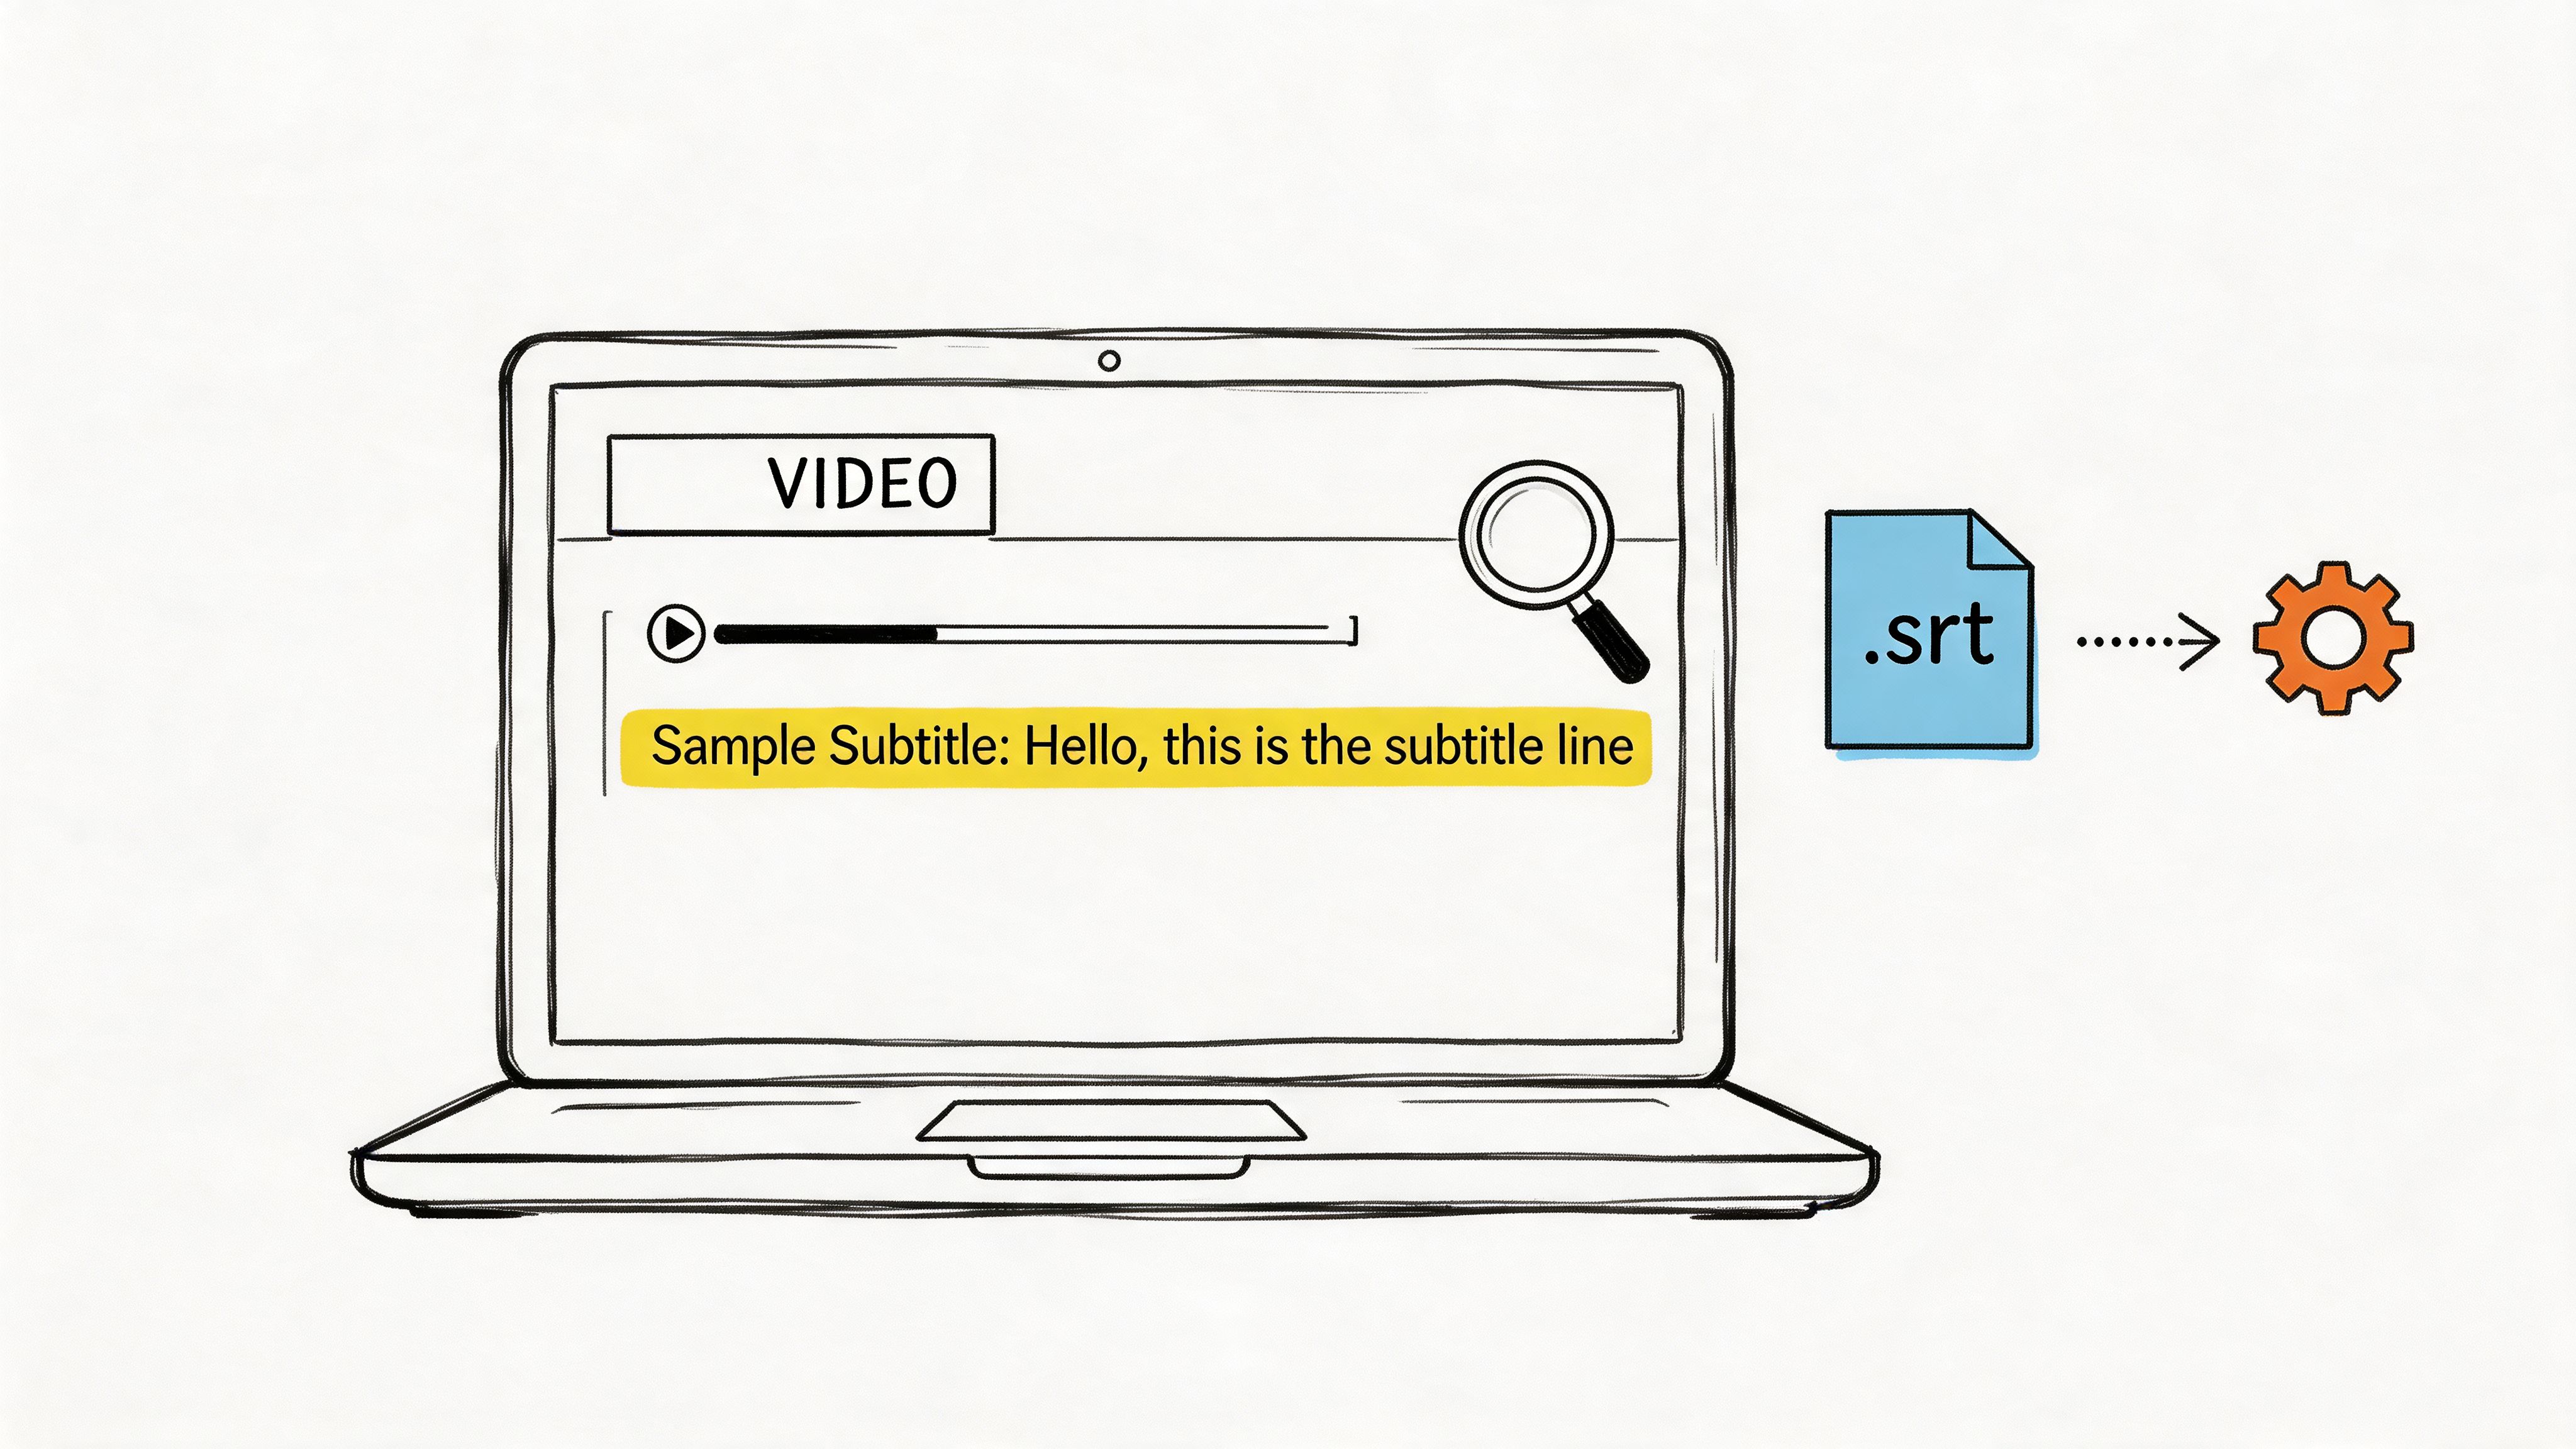
Now, automated transcription services can do the same job in minutes. A tool like HypeScribe can turn your audio and video files into clean, searchable text with up to 99% accuracy. This instantly transforms your raw data. Instead of a stack of audio files, you get a searchable database of every conversation, making it easy to find key phrases or topics across all your interviews. You can learn more about improving your entire process in our guide on qualitative research transcription.
The real value of automation isn't just speed; it's about making your data instantly accessible and interactive. When you can search a transcript as easily as a document, you unlock new possibilities for exploration and connection-finding that were impossible with traditional methods.
This kind of efficiency is a game-changer for any organization. Suddenly, analyzing meeting transcripts, customer feedback calls, and team discussions becomes practical. It provides the "why" behind your quantitative data, helping teams move from raw information to smart decisions that actually improve the business.
Accelerating Familiarization with Smart Summaries
Once you have your transcripts, the next step is getting to know your data. Traditionally, this meant reading every transcript multiple times. AI can give you a major head start here by generating smart summaries, pulling out key takeaways, and even listing potential action items directly from the text.
This gives you a bird's-eye view of each conversation right away. Before you even begin the detailed, line-by-line coding, you already have a sense of the main themes, common ideas, and critical moments. Think of it as a roadmap that points you to the most promising areas, making your coding process much more focused and effective.
The right tools can genuinely transform your workflow. To get a broader sense of what's out there, you might want to explore a list of the 12 best AI for data analysis tools. By adopting these technologies, you can reclaim dozens of hours once lost to manual grunt work and put your energy where it truly matters: uncovering the human stories hidden in your data.
How to Present Your Qualitative Findings
You've spent weeks sifting through transcripts, meticulously coding, and pulling out the core themes from your data. The "aha!" moments have happened. But here's the thing: those insights are only as good as your ability to communicate them.
The real test is turning your detailed analysis into a clear, persuasive story that makes your audience sit up and listen.
Simply dropping a list of themes into a slide deck won’t cut it. You need to build a narrative that walks stakeholders through your discovery process, connects the dots for them, and makes your conclusions feel both obvious and urgent. It’s about transforming your hard work into a story that sticks.
Structure Your Report Like a Story
The best qualitative reports I’ve seen all follow a similar path. They guide the reader along the same journey you took, starting with the big picture and drilling down to specific, actionable takeaways.
A solid, logical flow usually looks something like this:
- Executive Summary: Start right at the top with your most critical findings. If a busy executive only reads one page, what are the 2-3 things they absolutely need to know?
- Background and Methodology: Briefly set the scene. What question were you trying to answer, and which of the qualitative data analysis methods did you use to get there? This isn't about jargon; it's about building trust in your process.
- Thematic Deep Dive: This is the heart of your report. Give each major theme its own section, and this is where you’ll present your evidence.
- Recommendations and Next Steps: Don’t leave them hanging. End with concrete, actionable suggestions that flow directly from your findings. What should the team do with this information tomorrow?
Structuring your report this way helps your audience understand not just what you found, but why it’s a big deal and what to do about it. For a deeper dive into organizing your work, our guide on how to organize research notes has some great frameworks.
Let the Data Speak for Itself
Your most powerful tool for persuasion isn't your own summary—it's the raw, unfiltered voice of your participants. Direct quotes bring your findings to life with a jolt of human reality that you simply can't replicate. They're the undeniable proof behind your analysis.
For example, instead of just saying, "Users struggled with initial navigation," let a user say it for you.
"I honestly had no idea where to click first. I just started tapping around randomly hoping something would happen. It was pretty frustrating."
– Participant 3
See the difference? That one quote conveys the emotional weight of the experience far better than a paragraph of your own explanation ever could. When you're picking quotes, look for the ones that are concise, pack an emotional punch, and perfectly capture the essence of your theme.
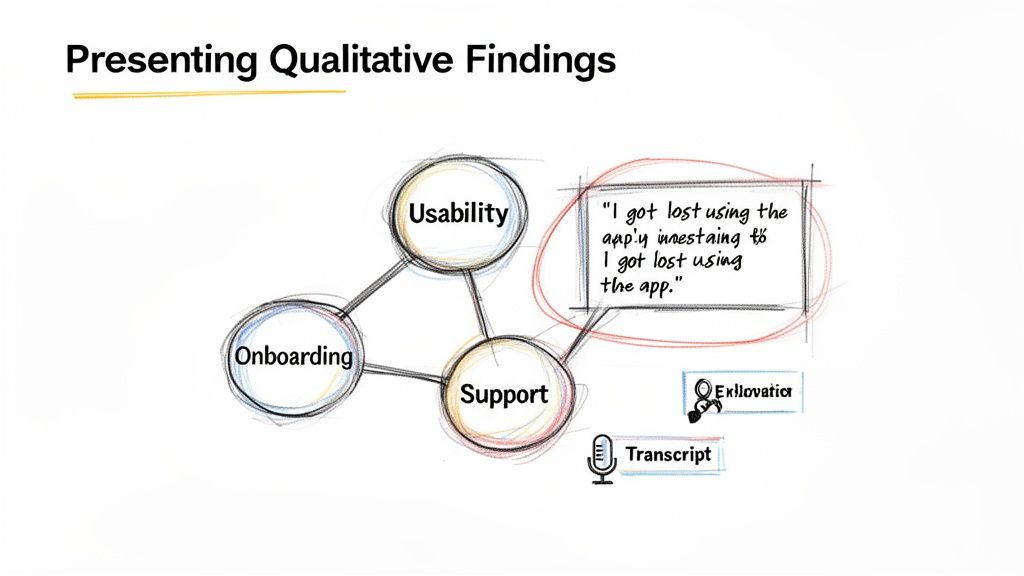
Visualize Your Qualitative Insights
Just because your data starts as text doesn't mean it has to end that way. Visuals are your secret weapon for making complex findings digestible. A good chart or map can break through the noise of a text-heavy report and help your audience grasp key relationships in an instant.
Here are a few visualization ideas that work wonders for qualitative data:
- Theme Maps: Think of a mind map that shows your core themes at the center with smaller, related sub-themes branching off. It’s a fantastic way to give a one-page overview of your entire analytical structure.
- Customer Journey Maps: These are perfect for showing a process or experience over time. You can plot the user's emotional highs and lows at each stage, peppering the map with key quotes that explain why they felt that way.
- Quote Cards: Pull out your most powerful quotes and put them on a visually striking slide or graphic. They're incredibly effective in a presentation and are easily shared across teams.
When you weave together a strong narrative, compelling quotes, and smart visuals, you're no longer just presenting data. You're telling a powerful story that grabs attention and, most importantly, drives meaningful change.
Common Questions About Qualitative Analysis
As you start digging into qualitative data analysis, theory is one thing, but putting it into practice with your own messy, real-world data is another beast entirely. It’s natural for a few practical questions to pop up right away. This section tackles some of the most common hurdles researchers and analysts face, head-on.
My goal here is to give you the confidence to move forward, troubleshoot those inevitable snags, and make smart decisions as you work through your analysis.
How Many Interviews Do I Really Need?
This is the big one, maybe the most-asked question in qualitative research. The honest answer? It’s less about a magic number and more about hitting a point called data saturation.
Imagine you’re interviewing people about their morning coffee routine. The first few interviews are a goldmine of new information—drip coffee, espresso, cold brew, specific brewing times, favorite mugs.
But after the fifth or sixth person, you start hearing the same stories. The patterns become predictable. When you can pretty much guess what the next participant will say because you’ve heard it all before, you've likely reached saturation. At that point, doing more interviews won't uncover new insights; they’ll just reinforce what you already know.
For most focused studies, you can often reach saturation with as few as 5 to 12 solid, in-depth interviews. The real key is to stop when you're no longer hearing new themes, not when you hit some arbitrary number. This makes sure your analysis is rich and deep without wasting time and resources.
Can I Combine Different Analysis Methods?
Absolutely, but you need to be intentional about it. Combining methods, a practice often called triangulation, can actually make your findings much stronger.
For example, you could start with Content Analysis to get a raw count of how often customers mention "price" versus "customer service." Then, you could layer Thematic Analysis on top of that same data to explore the emotions and context behind those mentions. Are they frustrated about the price? Delighted by the service? The two methods work together to paint a fuller picture.
The only risk is losing focus. Each method has its own logic and goals. If you start mixing and matching without a clear plan, your analysis can become a muddled mess. If you decide to combine methods, be deliberate and document exactly why and how each one helps answer a specific part of your research question.
What’s the Difference Between a Code and a Theme?
This one trips a lot of people up at first, but a simple analogy makes it click. Think of building a brick wall.
Codes are the individual bricks. They are the smallest, most basic building blocks of your analysis. A code is just a short label you attach to a specific quote or observation, like ‘confusing navigation’ or ‘fast checkout’.
Themes are the sections of the wall. A theme is the broader pattern or idea that connects several of your codes. You group your individual "brick" codes together to build a larger structure—a theme like "User Onboarding Challenges."
So, a code identifies a single, specific idea, while a theme tells a bigger story about what all those little ideas mean when you put them together. You can't have one without the other; you need the bricks to build the wall.
How Can I Minimize My Own Bias?
Great question. The first and most critical step in producing credible research is simply acknowledging that your perspective matters. In qualitative analysis, you are the primary analysis tool, so a little bias is almost inevitable. The trick is to manage it.
Fortunately, there are a few proven techniques to keep your personal views from clouding the data.
Actionable Techniques to Reduce Bias:
- Keep a Reflective Journal: As you analyze your data, keep a separate journal to jot down your own thoughts, assumptions, and feelings that pop up. This simple act of self-awareness helps you draw a clear line between your reactions and what the data is actually saying.
- Seek Peer Debriefing: Grab a colleague who isn’t involved in the project and ask them to look over your codes and themes. A fresh pair of eyes can instantly spot assumptions you’ve missed simply because you’re too close to the material.
- Look for Disconfirming Evidence: This is a big one. Actively hunt for quotes or examples that contradict your emerging themes. This process, sometimes called negative case analysis, stress-tests your conclusions and ensures your final report reflects the full complexity of the data, not just the parts that fit your initial hunches.
These qualitative data analysis methods are incredibly flexible and can be used in almost any field. Thematic analysis is a fantastic starting point and works well with interview transcripts, survey responses, and even observational notes. It's especially powerful for exploratory studies where the goal is to discover insights on various qualitative data analysis methods and understand a topic from multiple angles.
Ready to stop wasting hours on manual transcription and start finding insights faster? HypeScribe uses AI to turn your audio and video into accurate, searchable text in seconds. Get smart summaries, key takeaways, and a chatbot that can answer questions about your content.
Start your free trial at HypeScribe today!